Task Manager
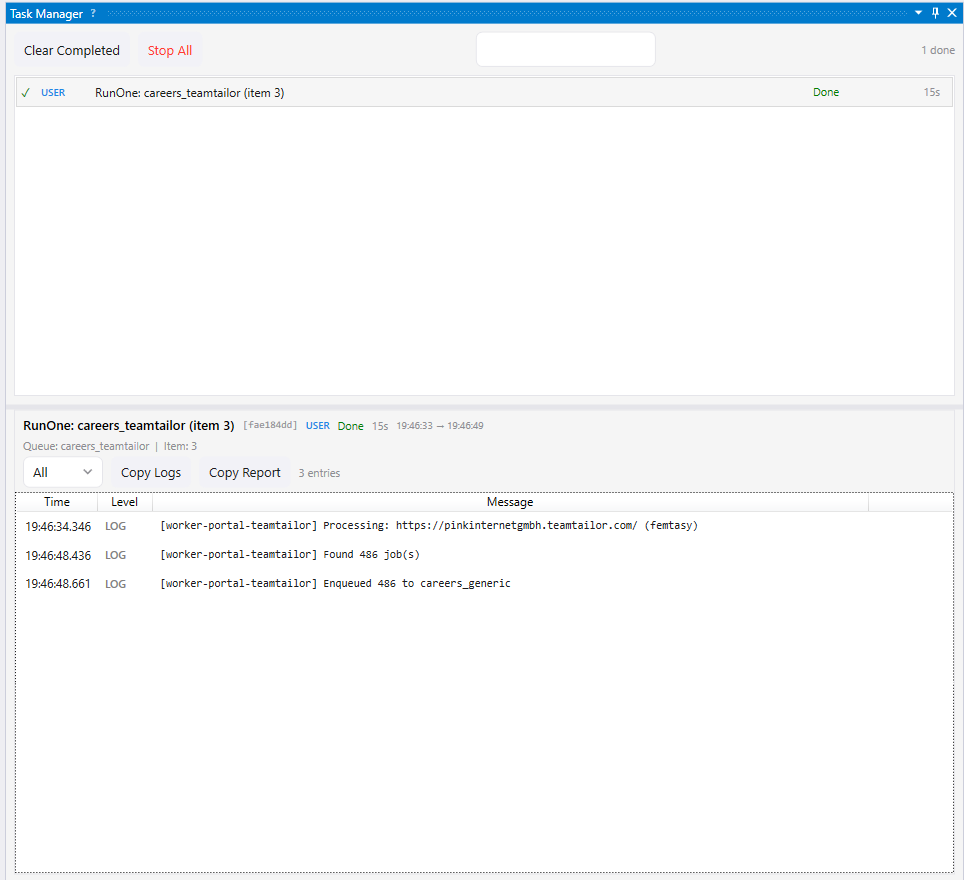
The Task Manager pane tracks every script execution — whether started manually, by an MCP tool call, a queue worker, or an event trigger. Click any task to inspect its logs, metadata, and execution context in a detail panel.
Task List
Section titled “Task List”Each task row shows a status icon, a colored origin label, the script name, live duration, and a stop button. Failed tasks display the error message inline.
| Status | Icon | Color |
|---|---|---|
| Running | ● | Blue |
| Completed | ✓ | Green |
| Failed | ✗ | Red |
| Stopped | ○ | Gray |
Origin Labels
Section titled “Origin Labels”Every task is tagged with a colored label showing what triggered it:
| Label | Meaning |
|---|---|
| USER (blue) | Script run from the Script Editor (F5) |
| MCP (orange) | MCP tool call from an external AI client |
| WORKER (purple) | Queue worker processing an item |
| EVENT (teal) | Event trigger (url-match, page-loaded, etc.) |
| QUEUE (olive) | Queue review action button |
| SYS (gray) | Internal system operation |
Detail Panel
Section titled “Detail Panel”Click a task to open the detail panel below the task list. The panel is resizable via the splitter and shows:
- Header — task name, 8-character ID, origin badge, status, duration, and start/end timestamps
- Error section — full error message for failed tasks (hidden otherwise)
- Context section — extra metadata depending on origin type (see below)
- Log viewer — all
g.log()calls made during this task’s execution
Per-Task Logs
Section titled “Per-Task Logs”Every g.log() call is automatically tagged with the task ID and persisted. No script changes are required — logging works exactly as before, but each task now keeps its own searchable log history.
The log viewer shows three columns:
| Column | Example |
|---|---|
| Time | 14:32:05.123 (local time, millisecond precision) |
| Level | LOG, INFO, WARN, ERROR (color-coded) |
| Message | The log message text |
For running tasks, logs update live as the script executes. For completed tasks, logs are loaded from the database.
Level Filter
Section titled “Level Filter”Use the dropdown above the log list to filter by level — select “All” to see everything, or pick a specific level like “ERROR” to focus on problems.
Context Info
Section titled “Context Info”Depending on what triggered the task, the detail panel shows additional context:
| Origin | Context shown |
|---|---|
| WORKER | Queue name, item key, worker index |
| MCP | Tool name (e.g., ExecuteScript, ExecuteScriptFile) |
| EVENT | Trigger type and URL pattern |
This makes it easy to trace exactly which queue item a worker was processing, which MCP tool triggered a script, or which event trigger fired.
Cross-Task Search
Section titled “Cross-Task Search”The search box in the toolbar searches across all task logs, not just the selected task. Type a search term and press Enter to find matching log entries across every execution. Clear the search box and press Enter to return to the selected task’s logs.
The search respects the level filter — if “ERROR” is selected, only error-level matches are shown.
Export
Section titled “Export”Two export options are available in the detail panel toolbar:
- Copy Logs — copies all log entries (respecting the current filter) as plain text
- Copy Report — copies a full task report as formatted JSON, including metadata, context, and all logs — useful for sharing diagnostics or pasting into issue trackers
Log Retention
Section titled “Log Retention”Task logs are automatically cleaned up on app startup. By default, logs older than 7 days are deleted. This can be changed via the TaskLogRetentionDays app setting (set to 0 to disable cleanup).
Next Steps
Section titled “Next Steps”- Queue Workers — batch processing with concurrent browser tabs
- Queues and Review — queue operations and visual review workflow for queue items
- Custom Tools — workspace-scoped MCP tools backed by scripts
- API Reference — full scripting API documentation